Clean up plots from their defaults.
theme_clean(font_size = 12, font_family = "", center_axis_labels = FALSE)

theme_trueMinimal(font_size = 12, font_family = "", center_axis_labels = FALSE)

theme_plotly(vis, MB = FALSE)

theme_blank(vis, MB = FALSE)
Arguments
| font_size | Font size for axis labels in theme_clean |
|---|---|
| font_family | Font family for axis labels in theme_clean |
| center_axis_labels | Logical. Center axis labels in theme_clean. Default is FALSE. |
| vis | |
| MB | For plotly, an option to display the mode bar. Defaults to FALSE. |
Details
From a gray background, to unnecessary gridlines, to by-default reference lines, some of the more popular visualization packages come out 75\ functions remove unnecessary gridlines, 'de-bold' the blacks, etc.
ggplot2:
theme_cleanThis function takes a ggplot object and removes the gray background, gridlines and adds opacity to the default black axes and labels, allowing the pattern of the visual to be expressed in unimpeded fashion.theme_trueMinimalwas the old name of this function and is still usable.plotly:
theme_plotly,theme_blankremoves reference lines at zero, and some of its 'modebar' is unnecessary. Otherwise little is changed at this point, except for theme_blank, which is like theme_void for ggplot.
Note
You may continue to override any aspect of these themes. For example with
ggplot2, you would just add a theme afterward just like you would any other
plot.
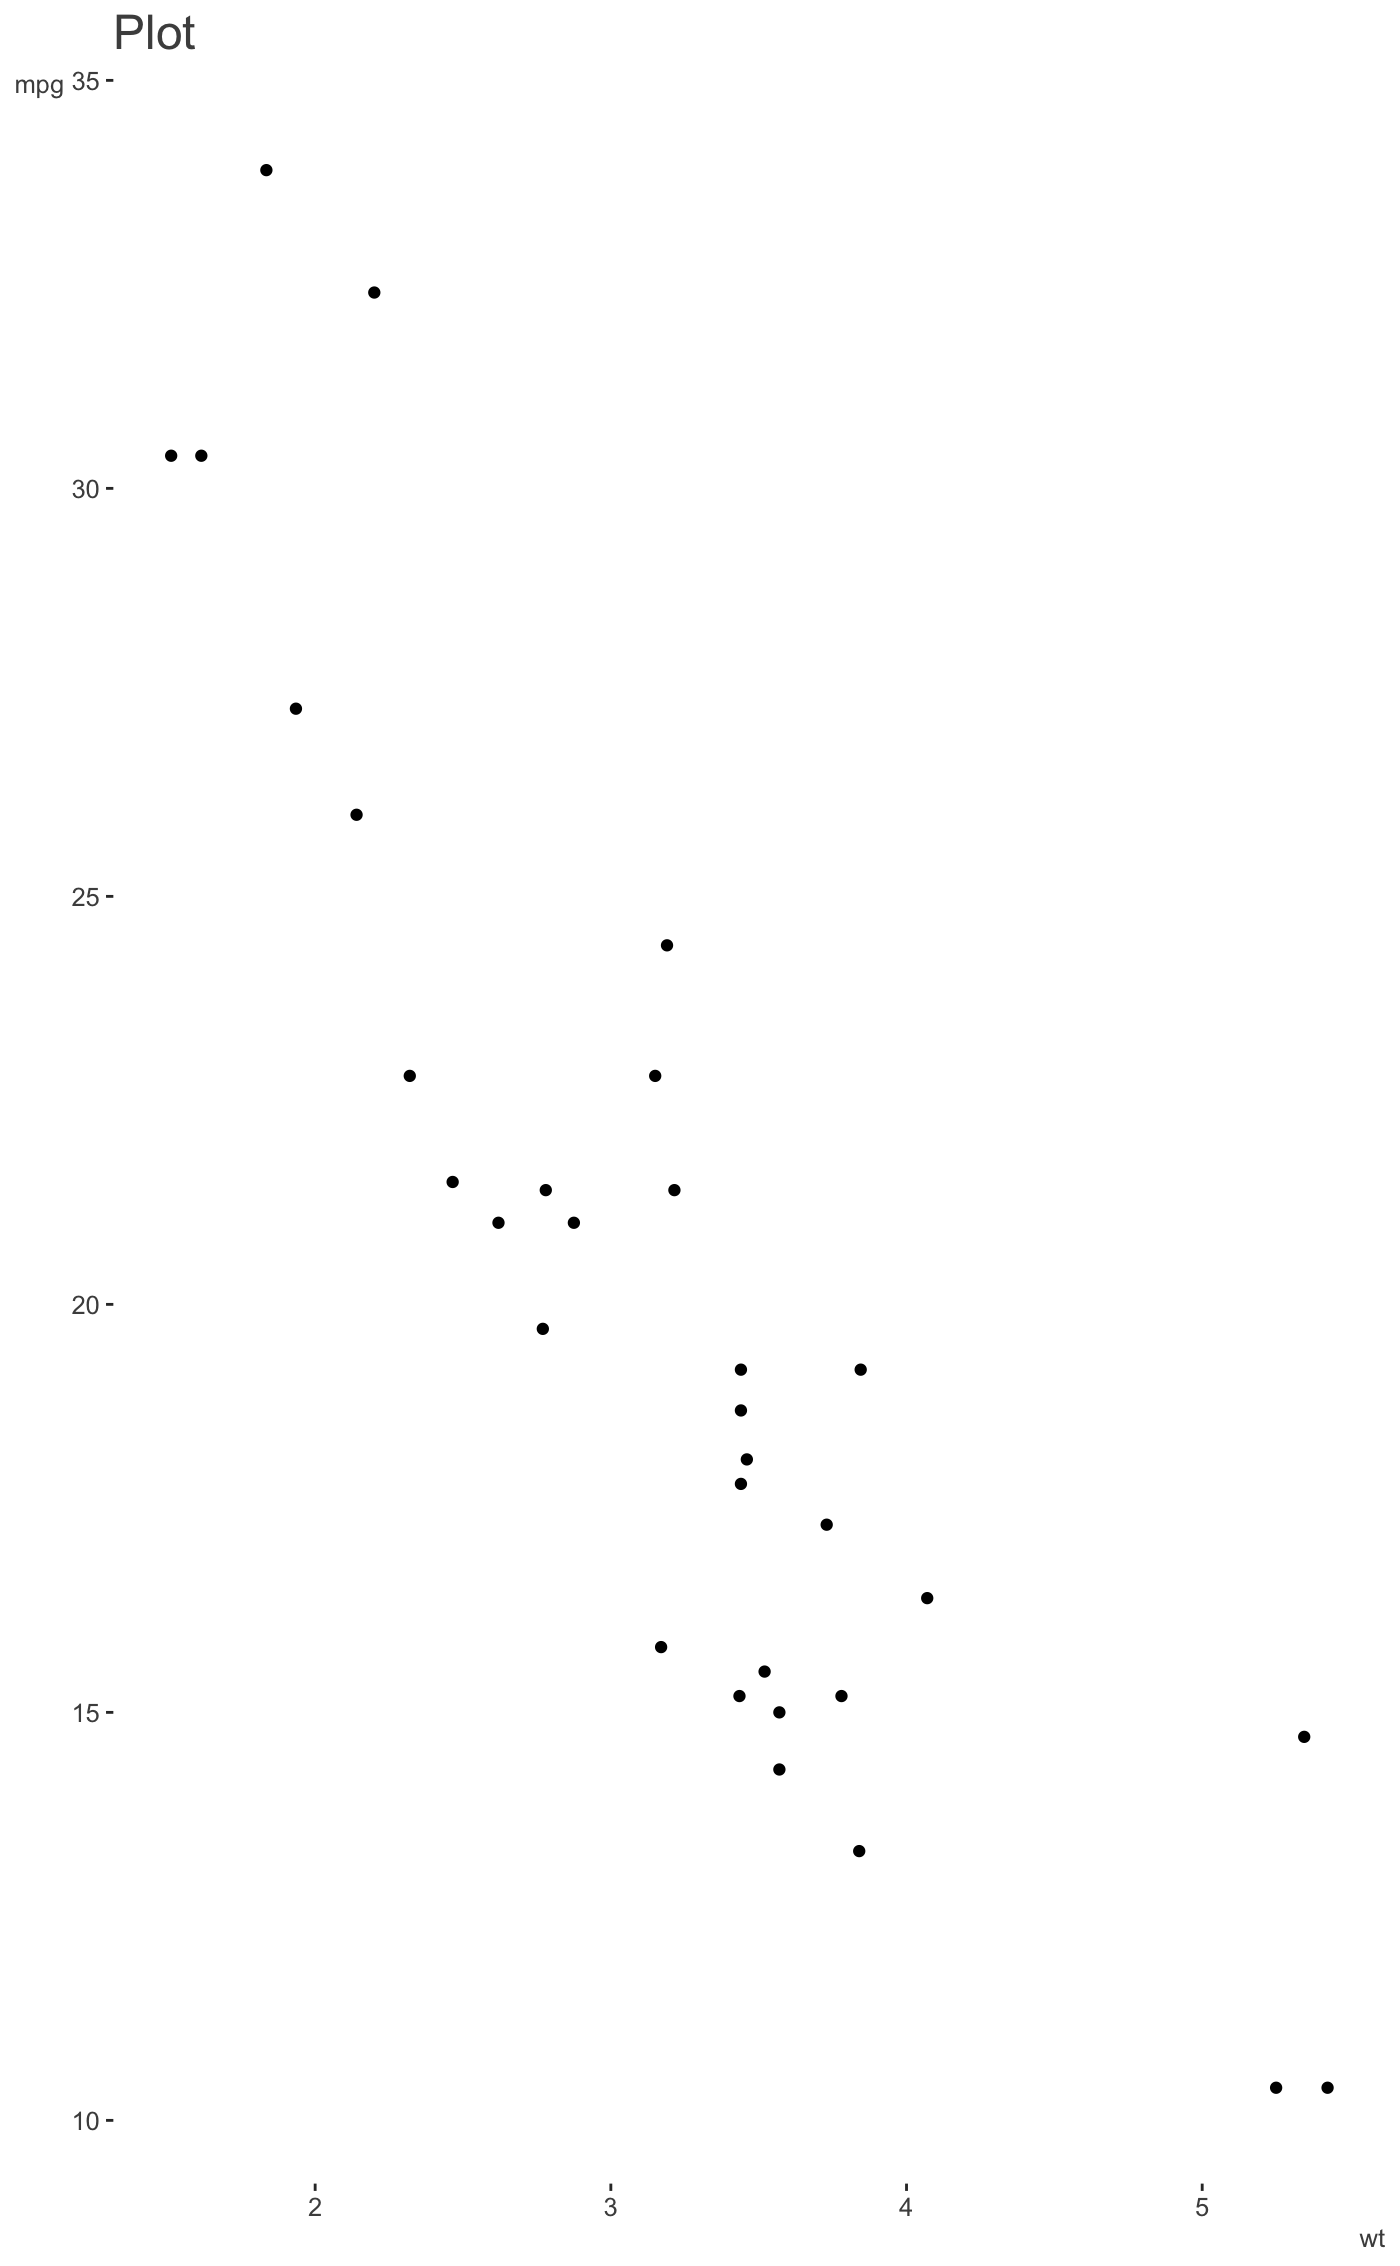
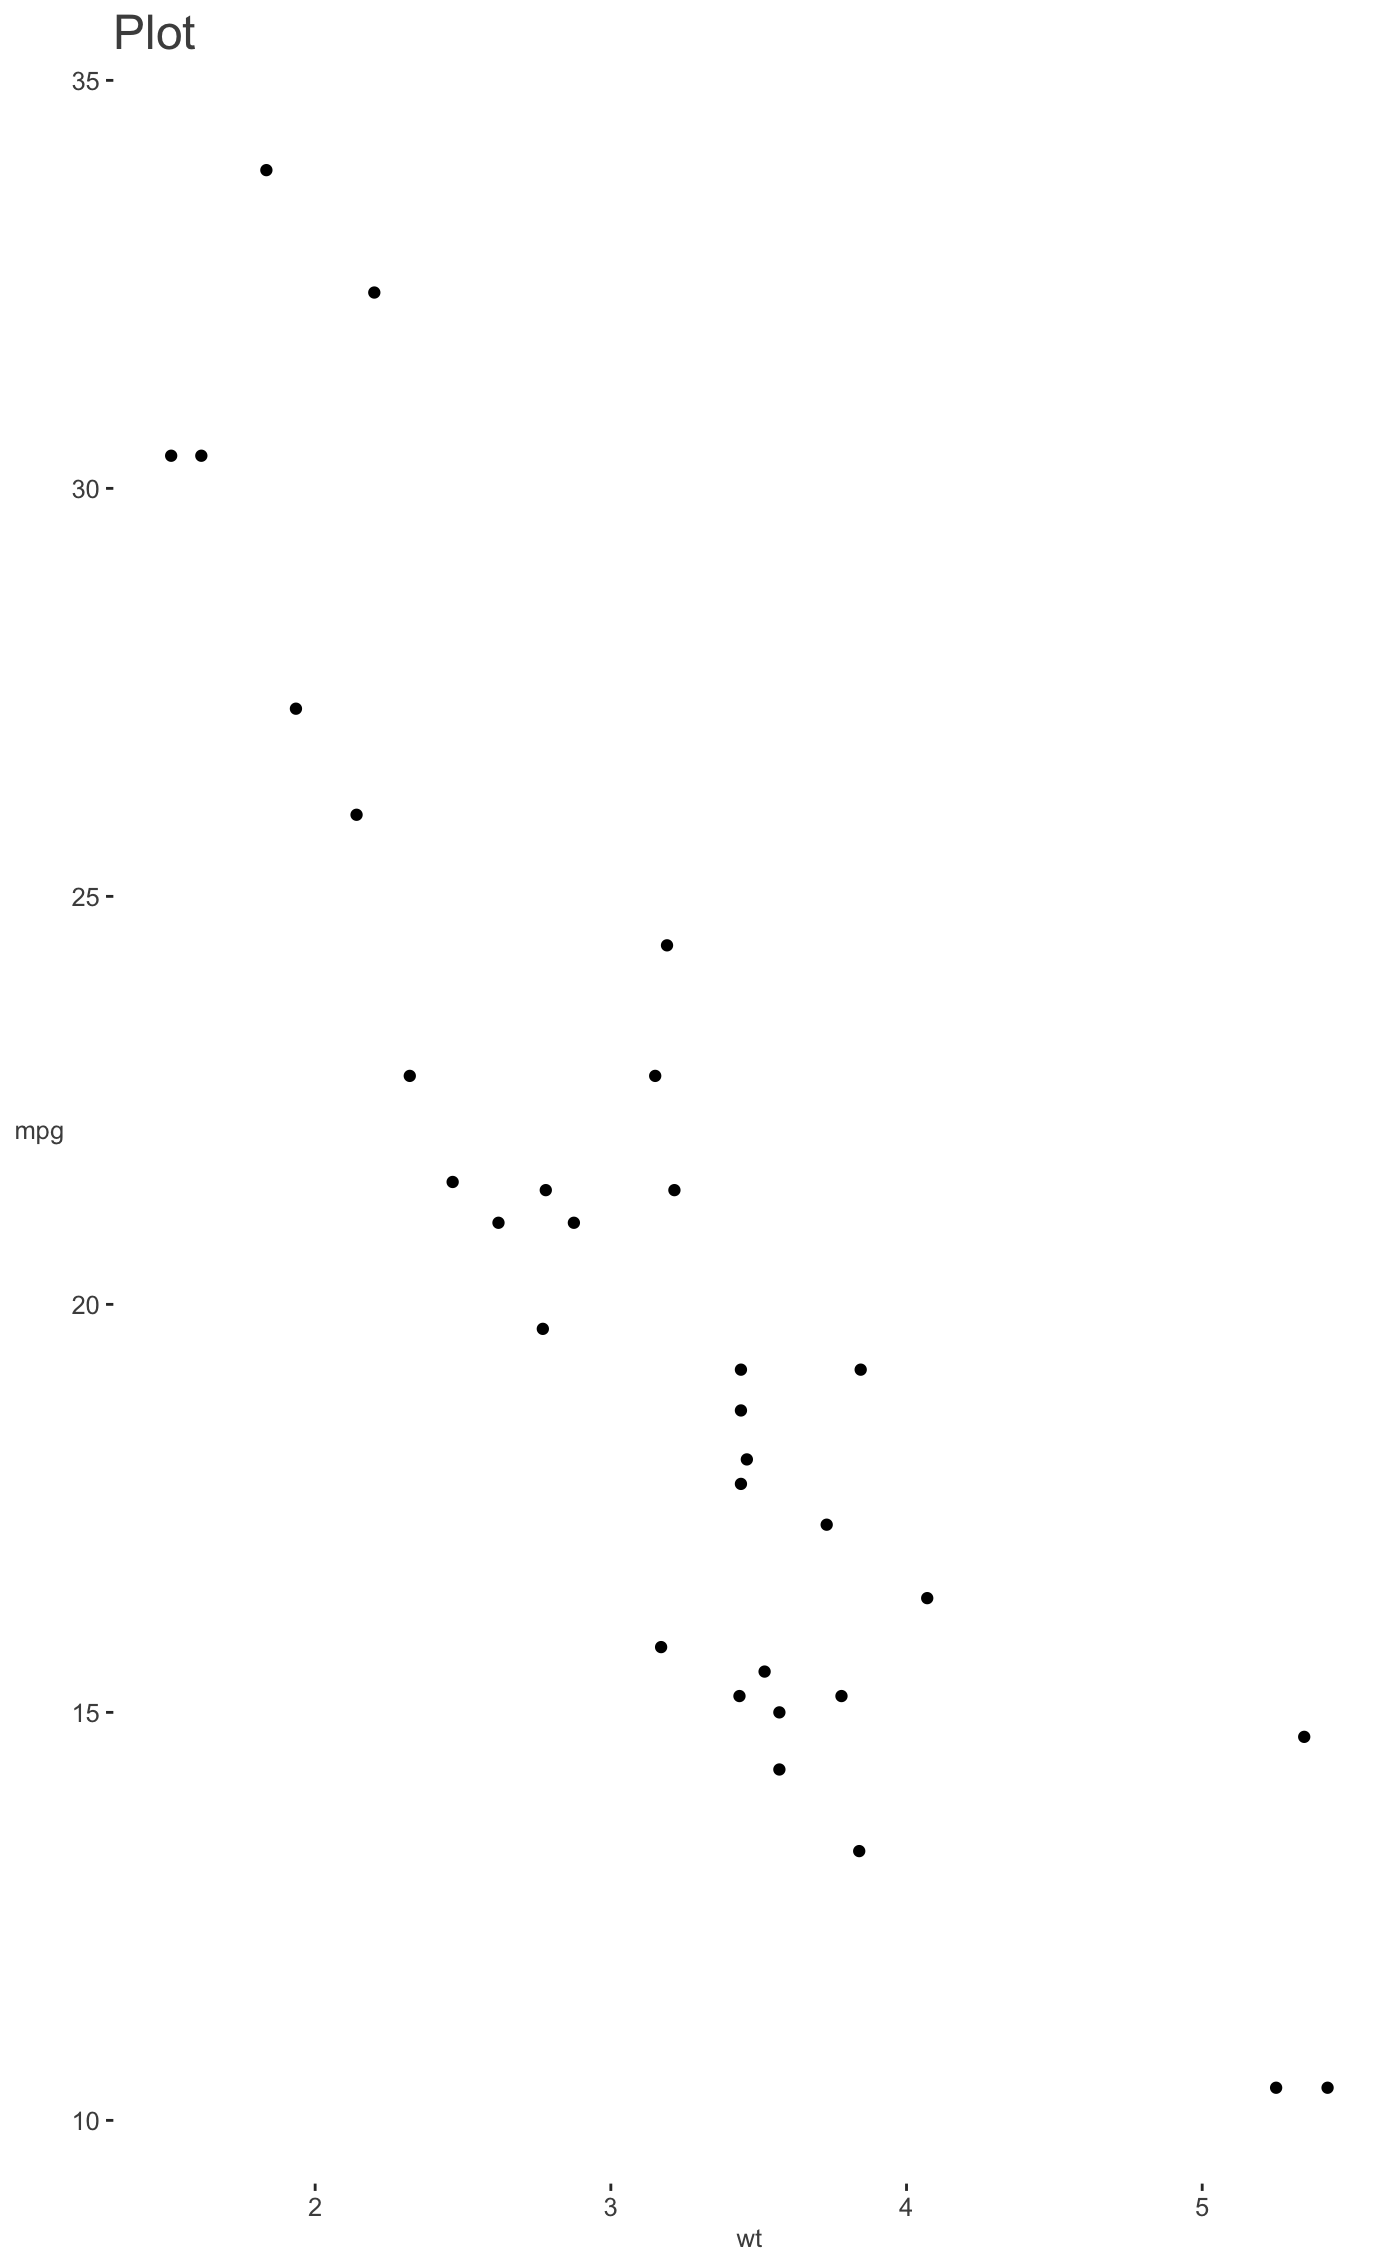
Examples
library(visibly) library(ggplot2) data(mtcars) ggplot(aes(wt, mpg), data=mtcars) + geom_point() + labs(title='Plot') + theme_clean()ggplot(aes(wt, mpg), data=mtcars) + geom_point() + labs(title='Plot') + theme_clean(center_axis_labels = TRUE)#> #>#> #> #>#> #> #>#> #> #>#> #> #>#> Warning: `arrange_()` is deprecated as of dplyr 0.7.0. #> Please use `arrange()` instead. #> See vignette('programming') for more help #> This warning is displayed once every 8 hours. #> Call `lifecycle::last_warnings()` to see where this warning was generated.#> #> #>