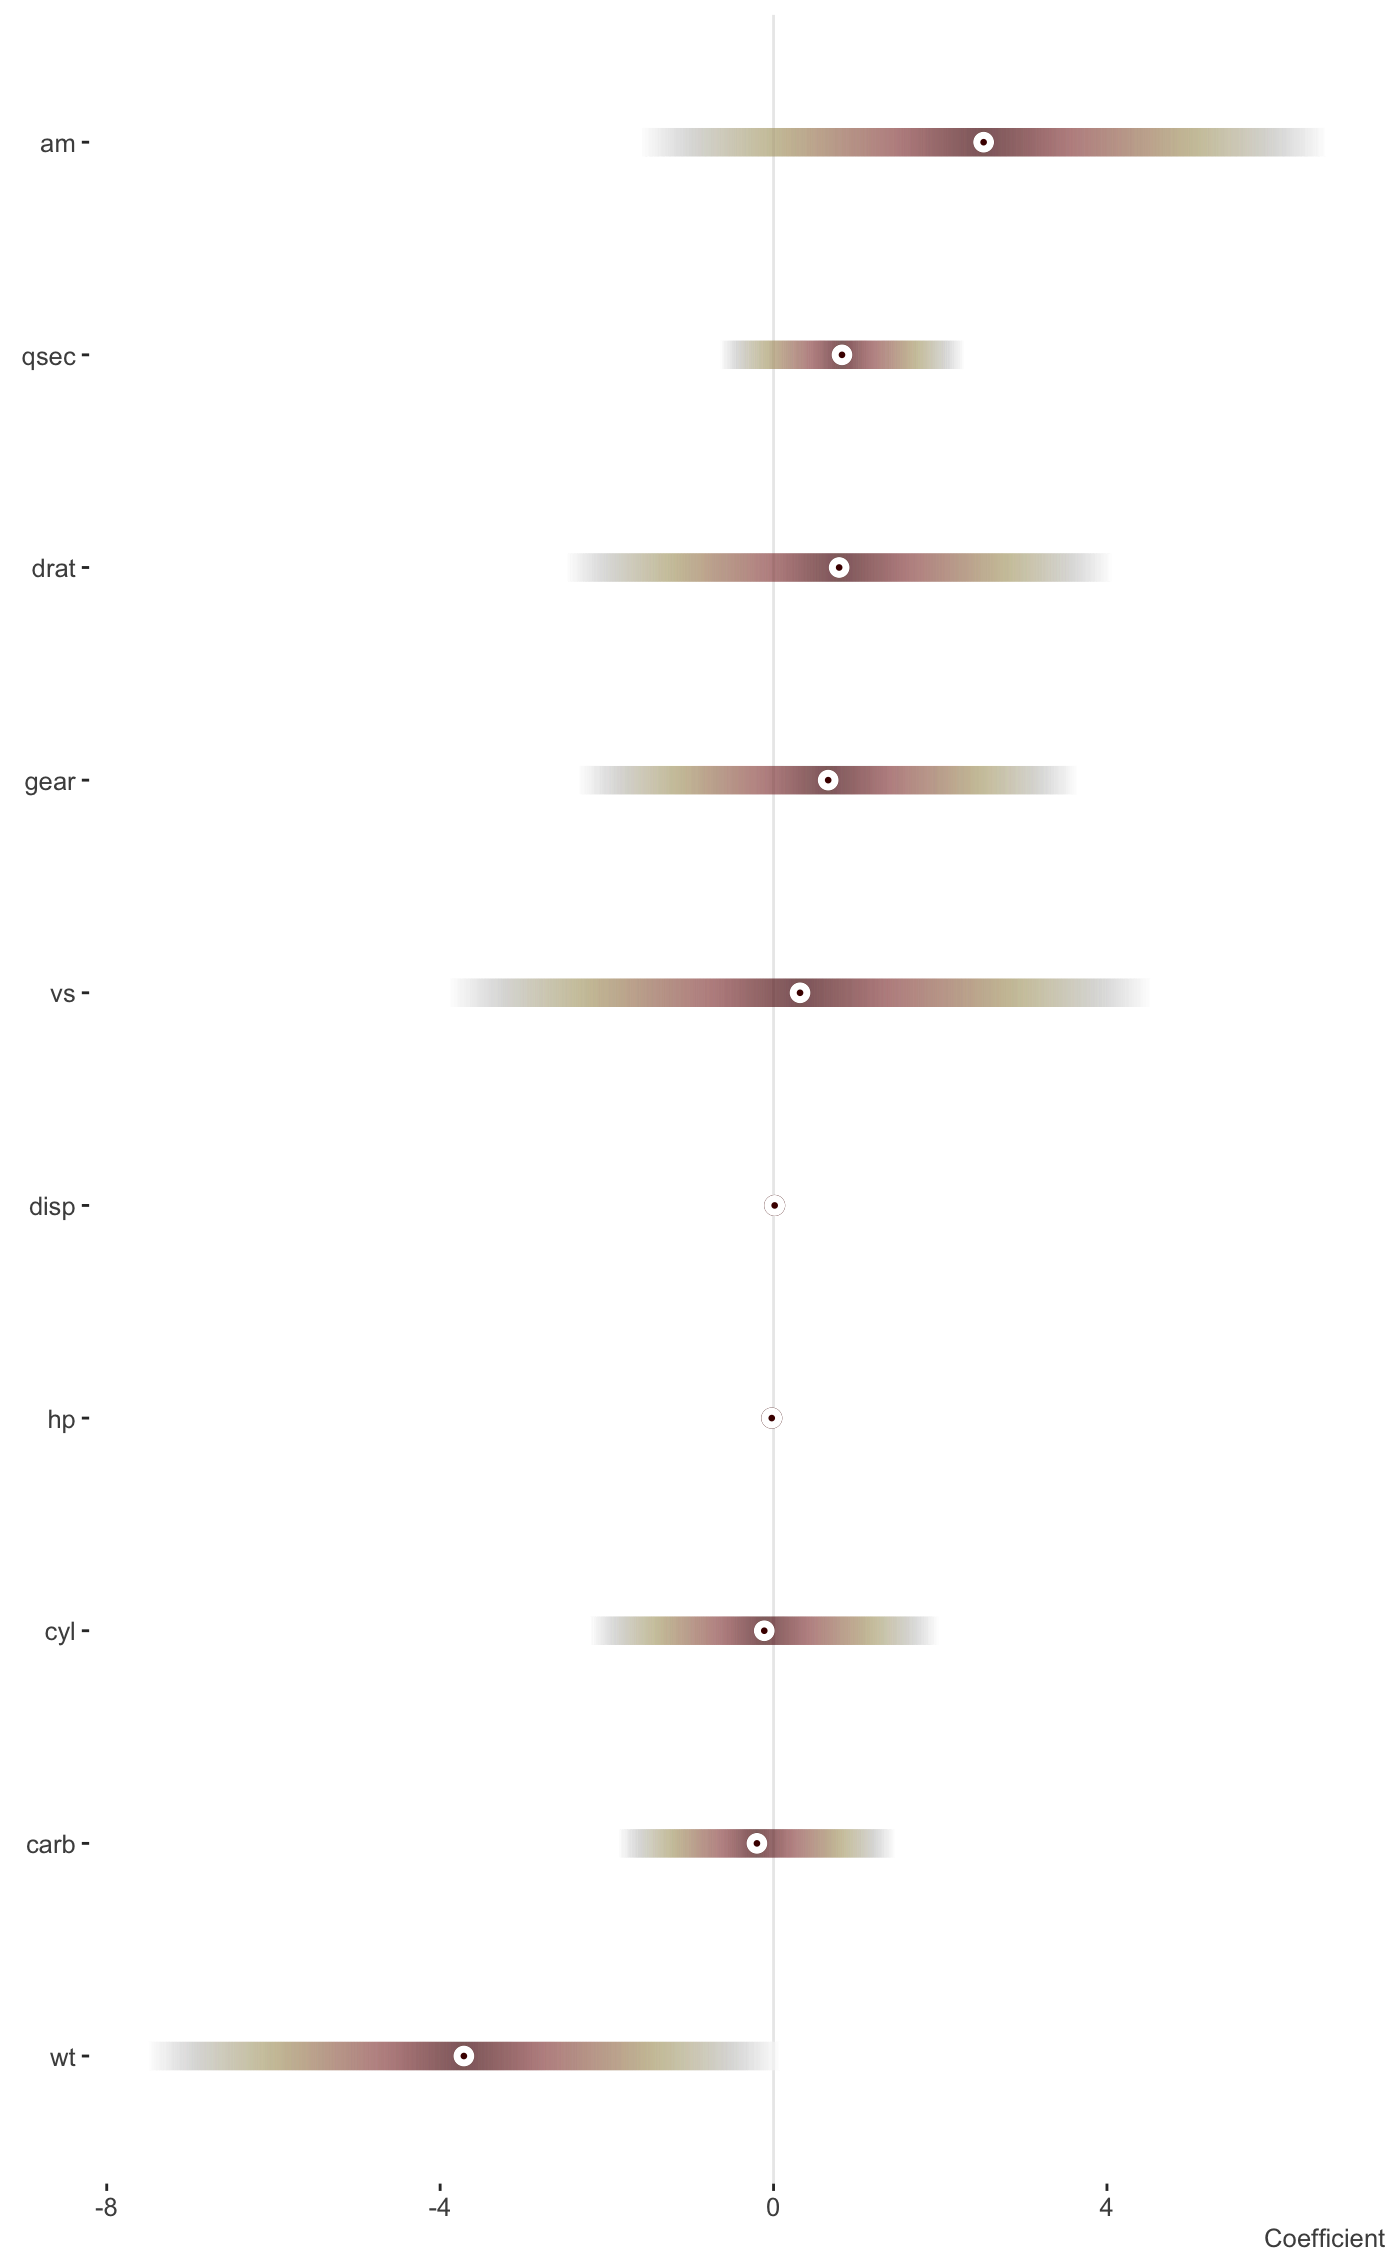
A basic plot of coefficients with their uncertainty interval.
plot_coefficients(model, ...)
Arguments
| model | The model. For example, lm, glm, gam, lme4, brms. |
|---|---|
| ... | Other arguments applied for specific methods. |
Value
A ggplot of the coefficients and their interval estimates. Or the data that would be used to create the plot.
See also
Other model visualization:
plot_coefficients.brmsfit(),
plot_coefficients.lm(),
plot_coefficients.merMod(),
plot_gam_2d(),
plot_gam_3d(),
plot_gam_check(),
plot_gam()