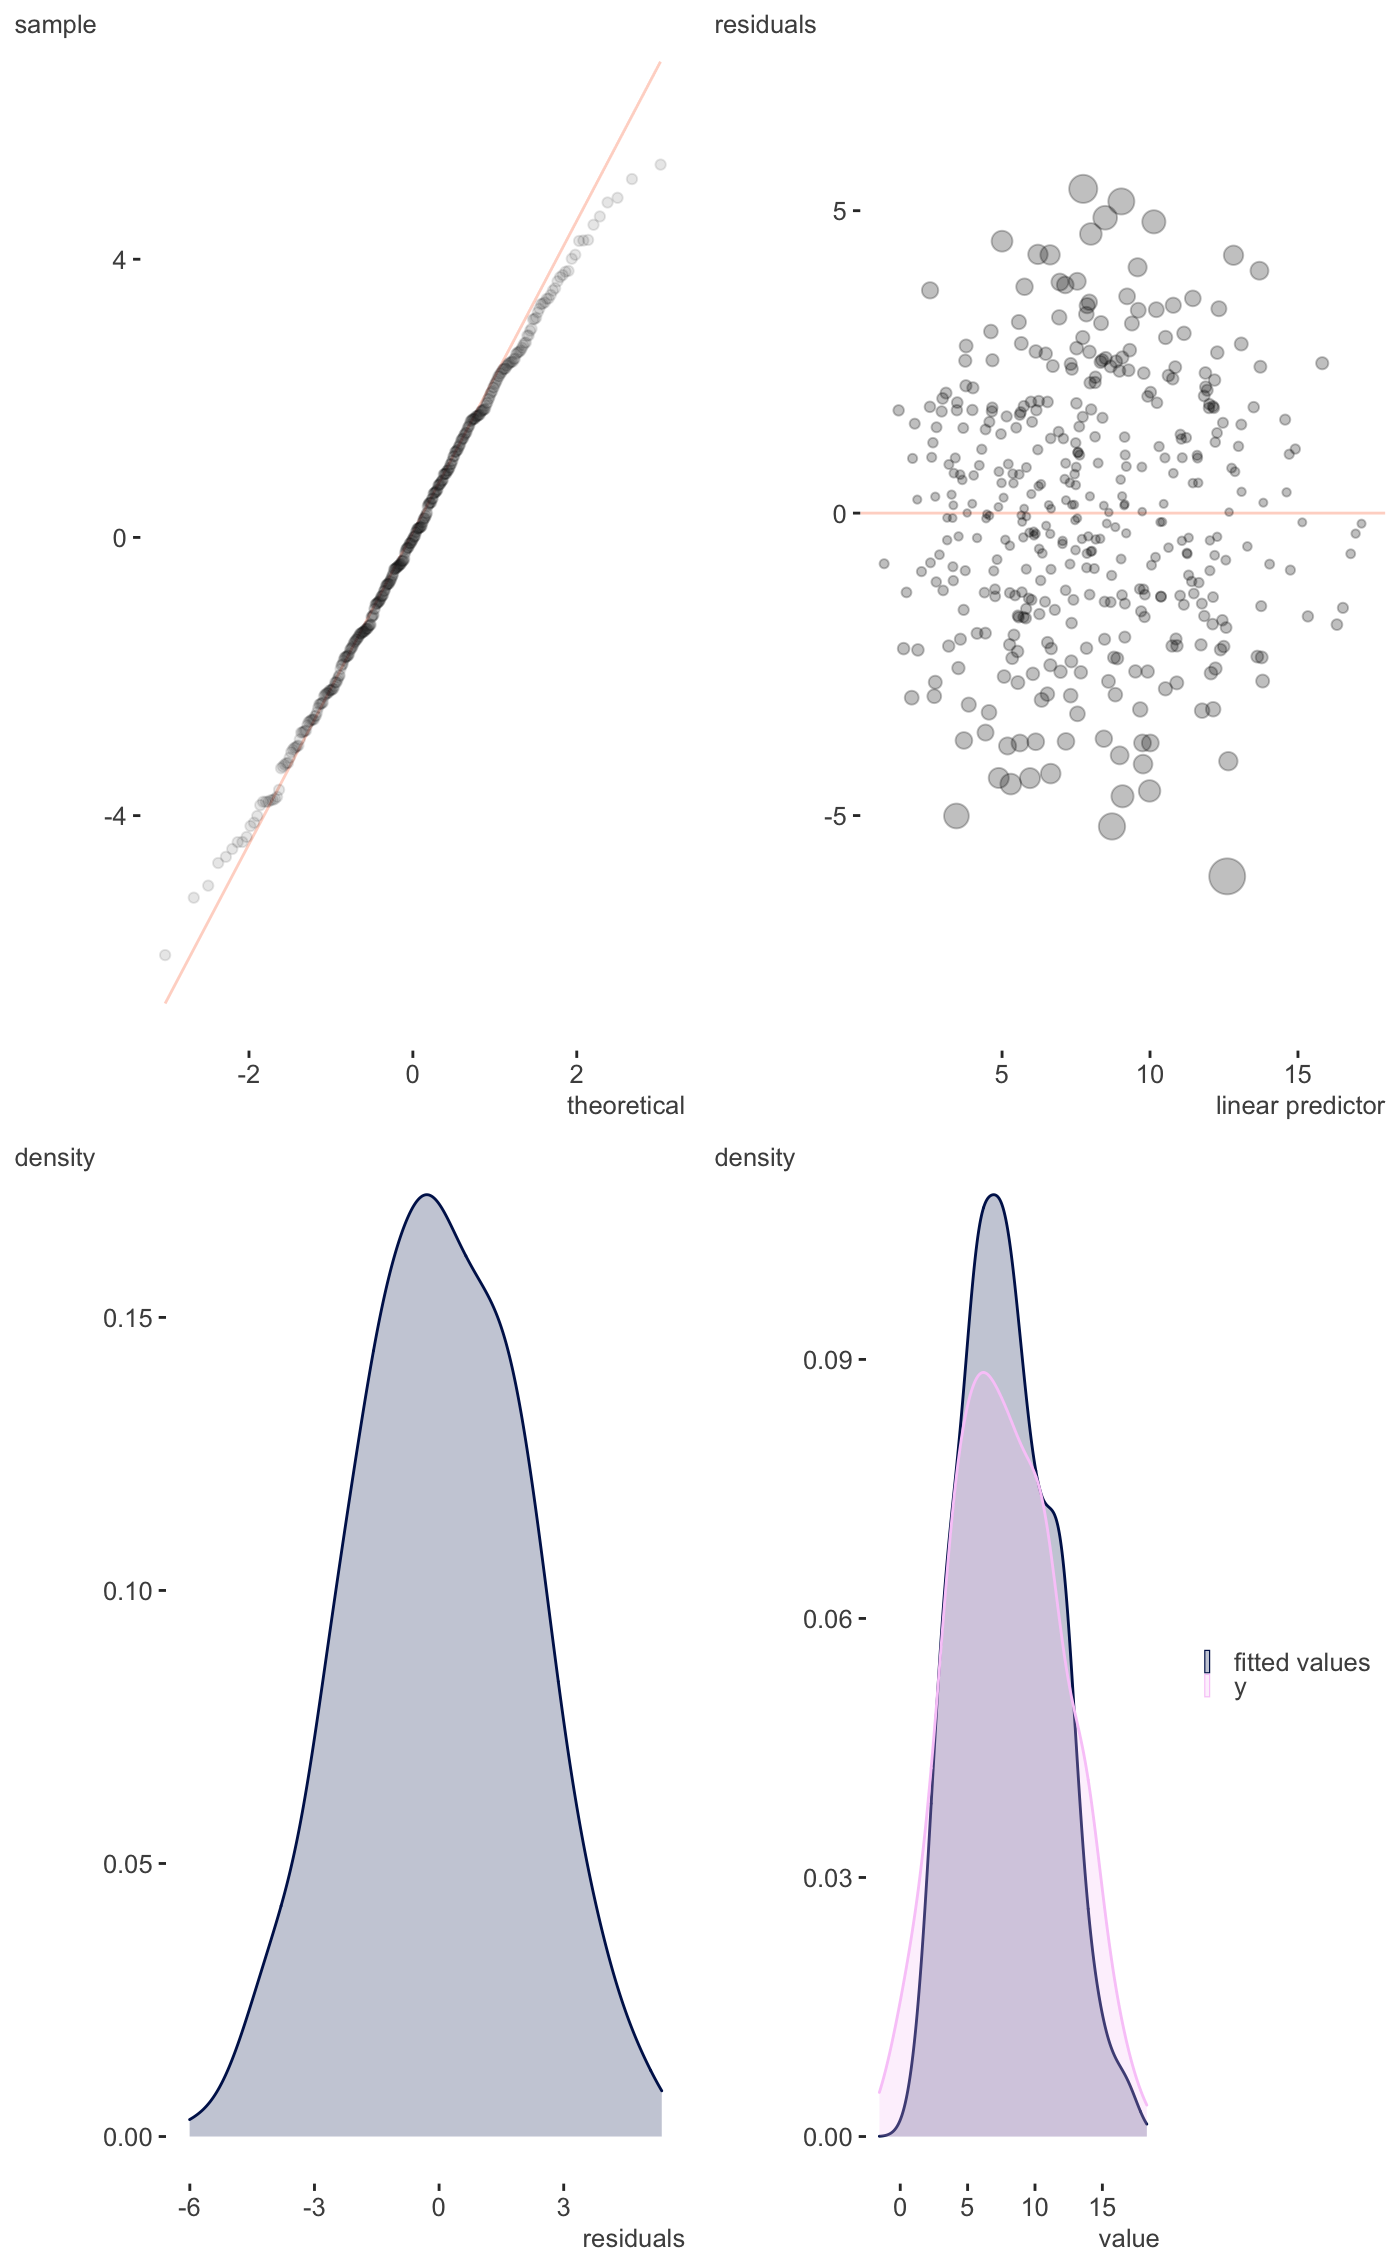
Residual plots etc.
plot_gam_check(
  model,
  single_page = TRUE,
  type = "deviance",
  scatter = FALSE,
  kcheck = FALSE
)
Arguments
| model | The mgcv gam model |
|---|---|
| single_page | Plot all on a single page. Requires grid.arrange |
| type | The type of residuals wanted. Usually one of "deviance", "pearson","scaled.pearson", "working", or "response"., See residuals.gam. |
| scatter | Whether to plot fitted vs. observed target variable as scatter plot or density. Default is FALSE (density). |
| kcheck | If you want the slightly less verbose basis dimension (k) checking results. Default is FALSE. When true, only uses the defaults of gam.check. If you need to do more, use mgcv. |
Value
A ggplot that provides visual inspection of residuals and more.
Details
Just a single page version of gam.check.
See also
Other model visualization:
plot_coefficients.brmsfit(),
plot_coefficients.lm(),
plot_coefficients.merMod(),
plot_coefficients(),
plot_gam_2d(),
plot_gam_3d(),
plot_gam()
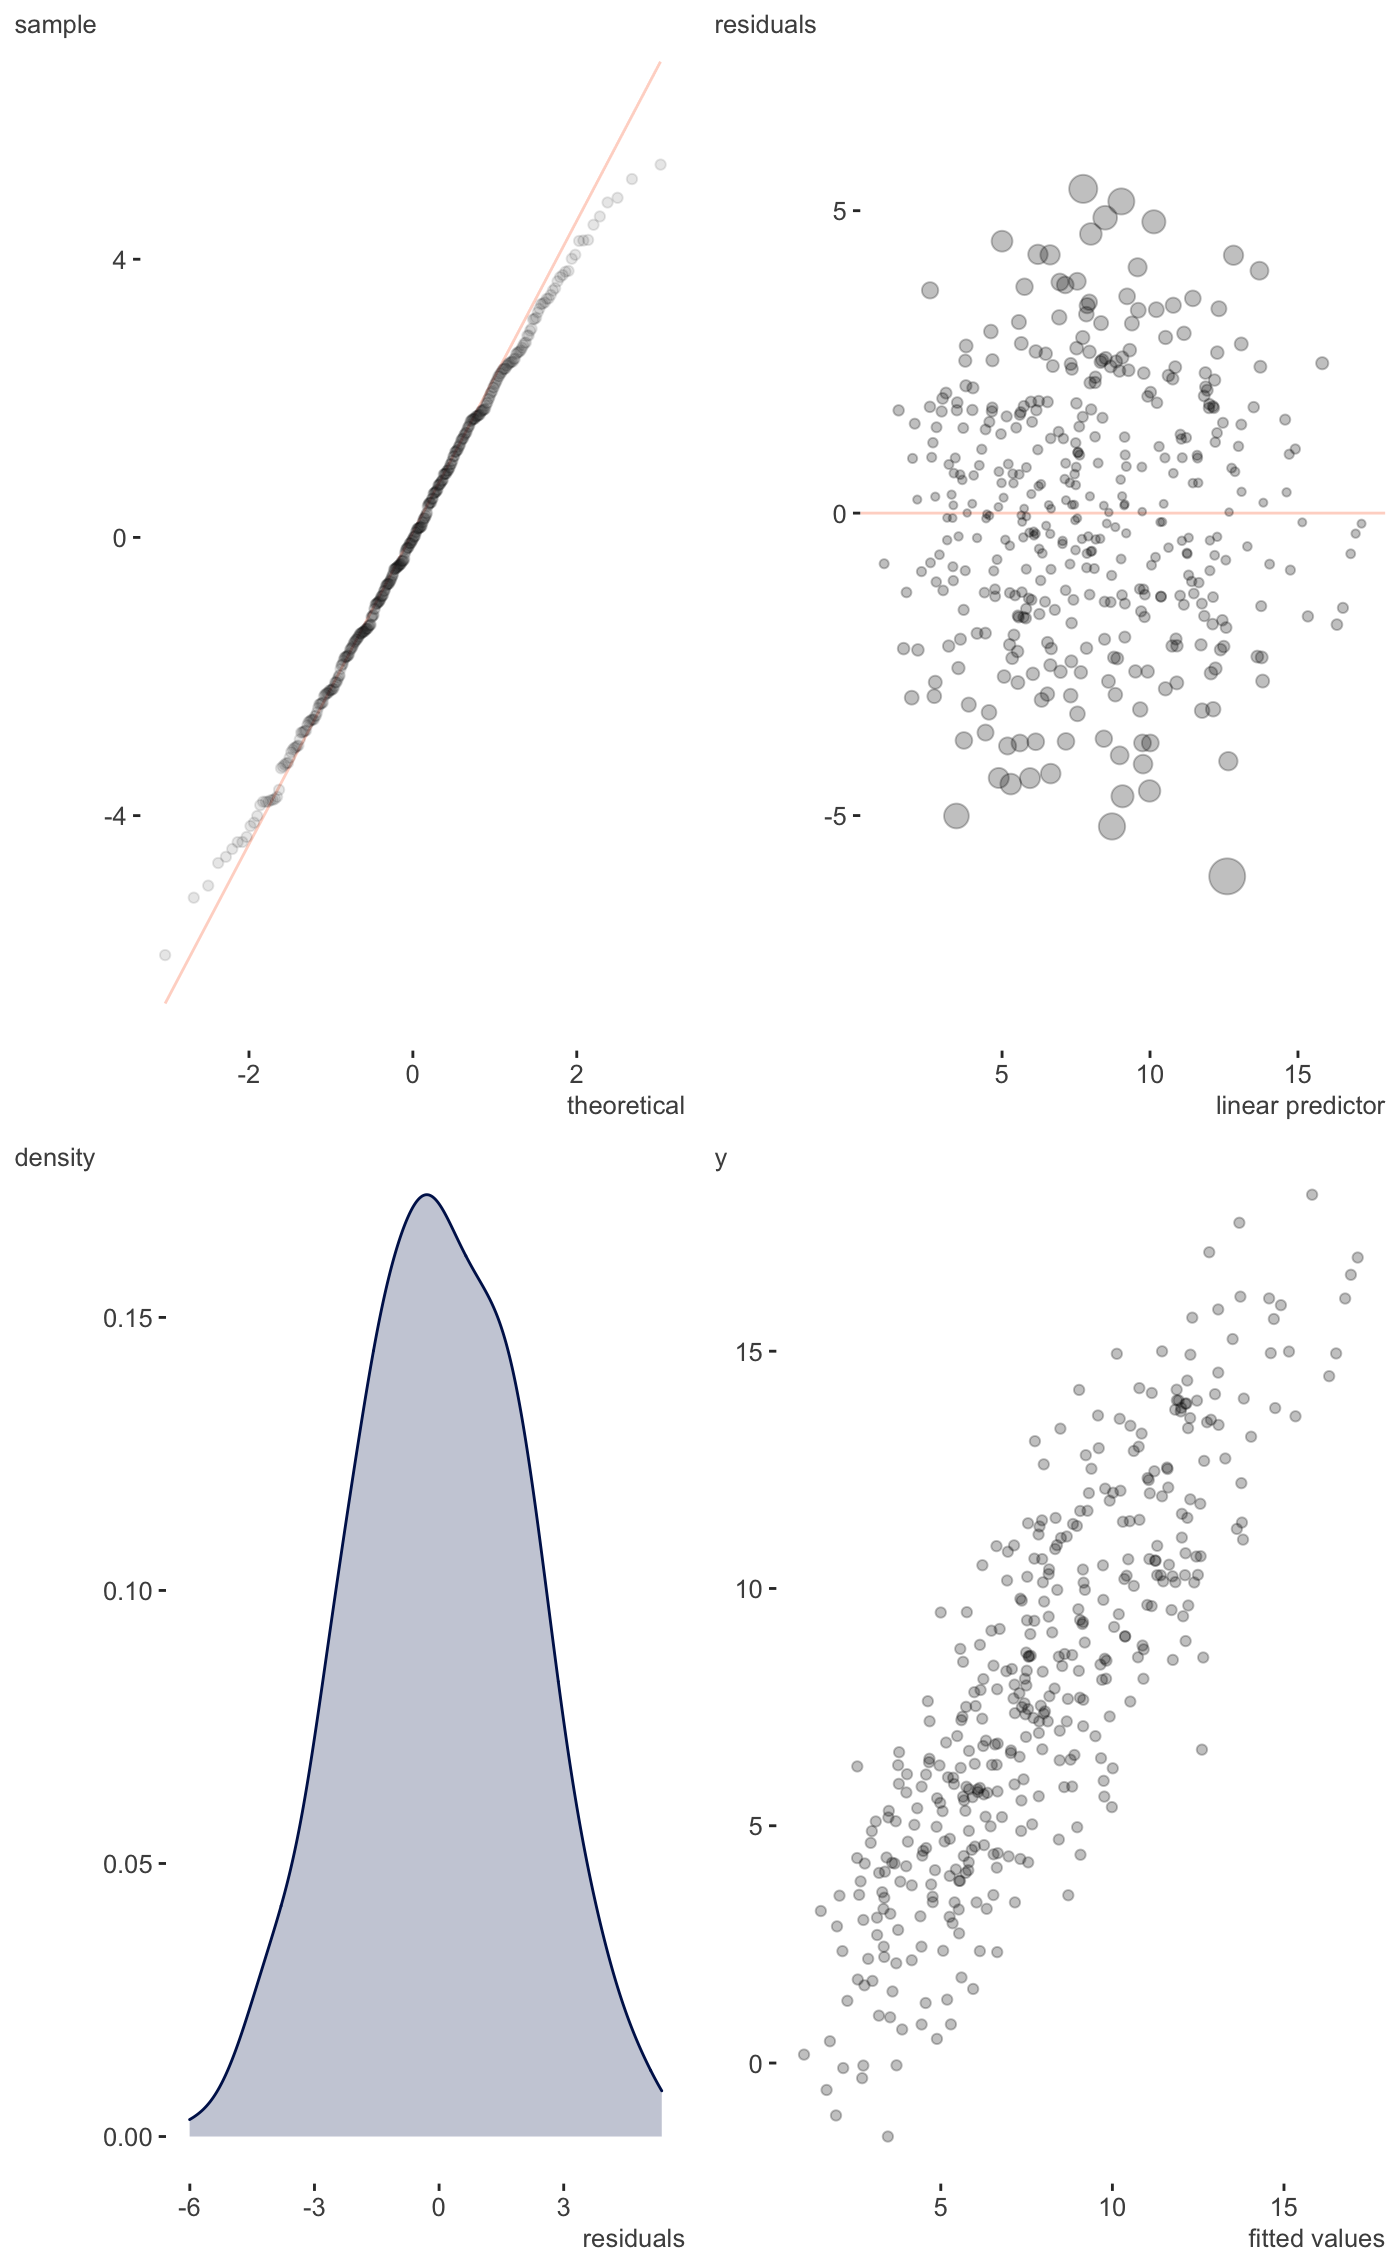
Examples
#> Gu & Wahba 4 term additive modelplot_gam_check(g_fit, scatter=TRUE)