Plot 2-way GAM smooths Plot 2-dimensional smooth terms
plot_gam_2d(
  model,
  main_var,
  second_var,
  conditional_data = NULL,
  n_plot = 100,
  force_2d = FALSE,
  ...
)

plot_gam_by(
  model,
  main_var,
  by_var,
  conditional_data = NULL,
  n_plot = 500,
  ...
)
Arguments
| model | The mgcv GAM. |
|---|---|
| main_var | Which variable do you want to plot? Uses bare variable names
and can take multiple variables via |
| second_var | Required for plot_gam_2d. The second continuous variable of interest. |
| conditional_data | This is the same as the newdata argument for predict
and passed to |
| n_plot | How many plotting points for the main_var/second_var? Default is 100, creating a 100 x 100 grid of points. |
| force_2d | If the second_var has <= 5 values, the plot_gam_by is called. This will override that. |
| ... | Options to scale_fill_scico for plot_gam_2d or scale_color_viridis_d for plot_gam_by (scale_color_scico_d if using scico development version). |
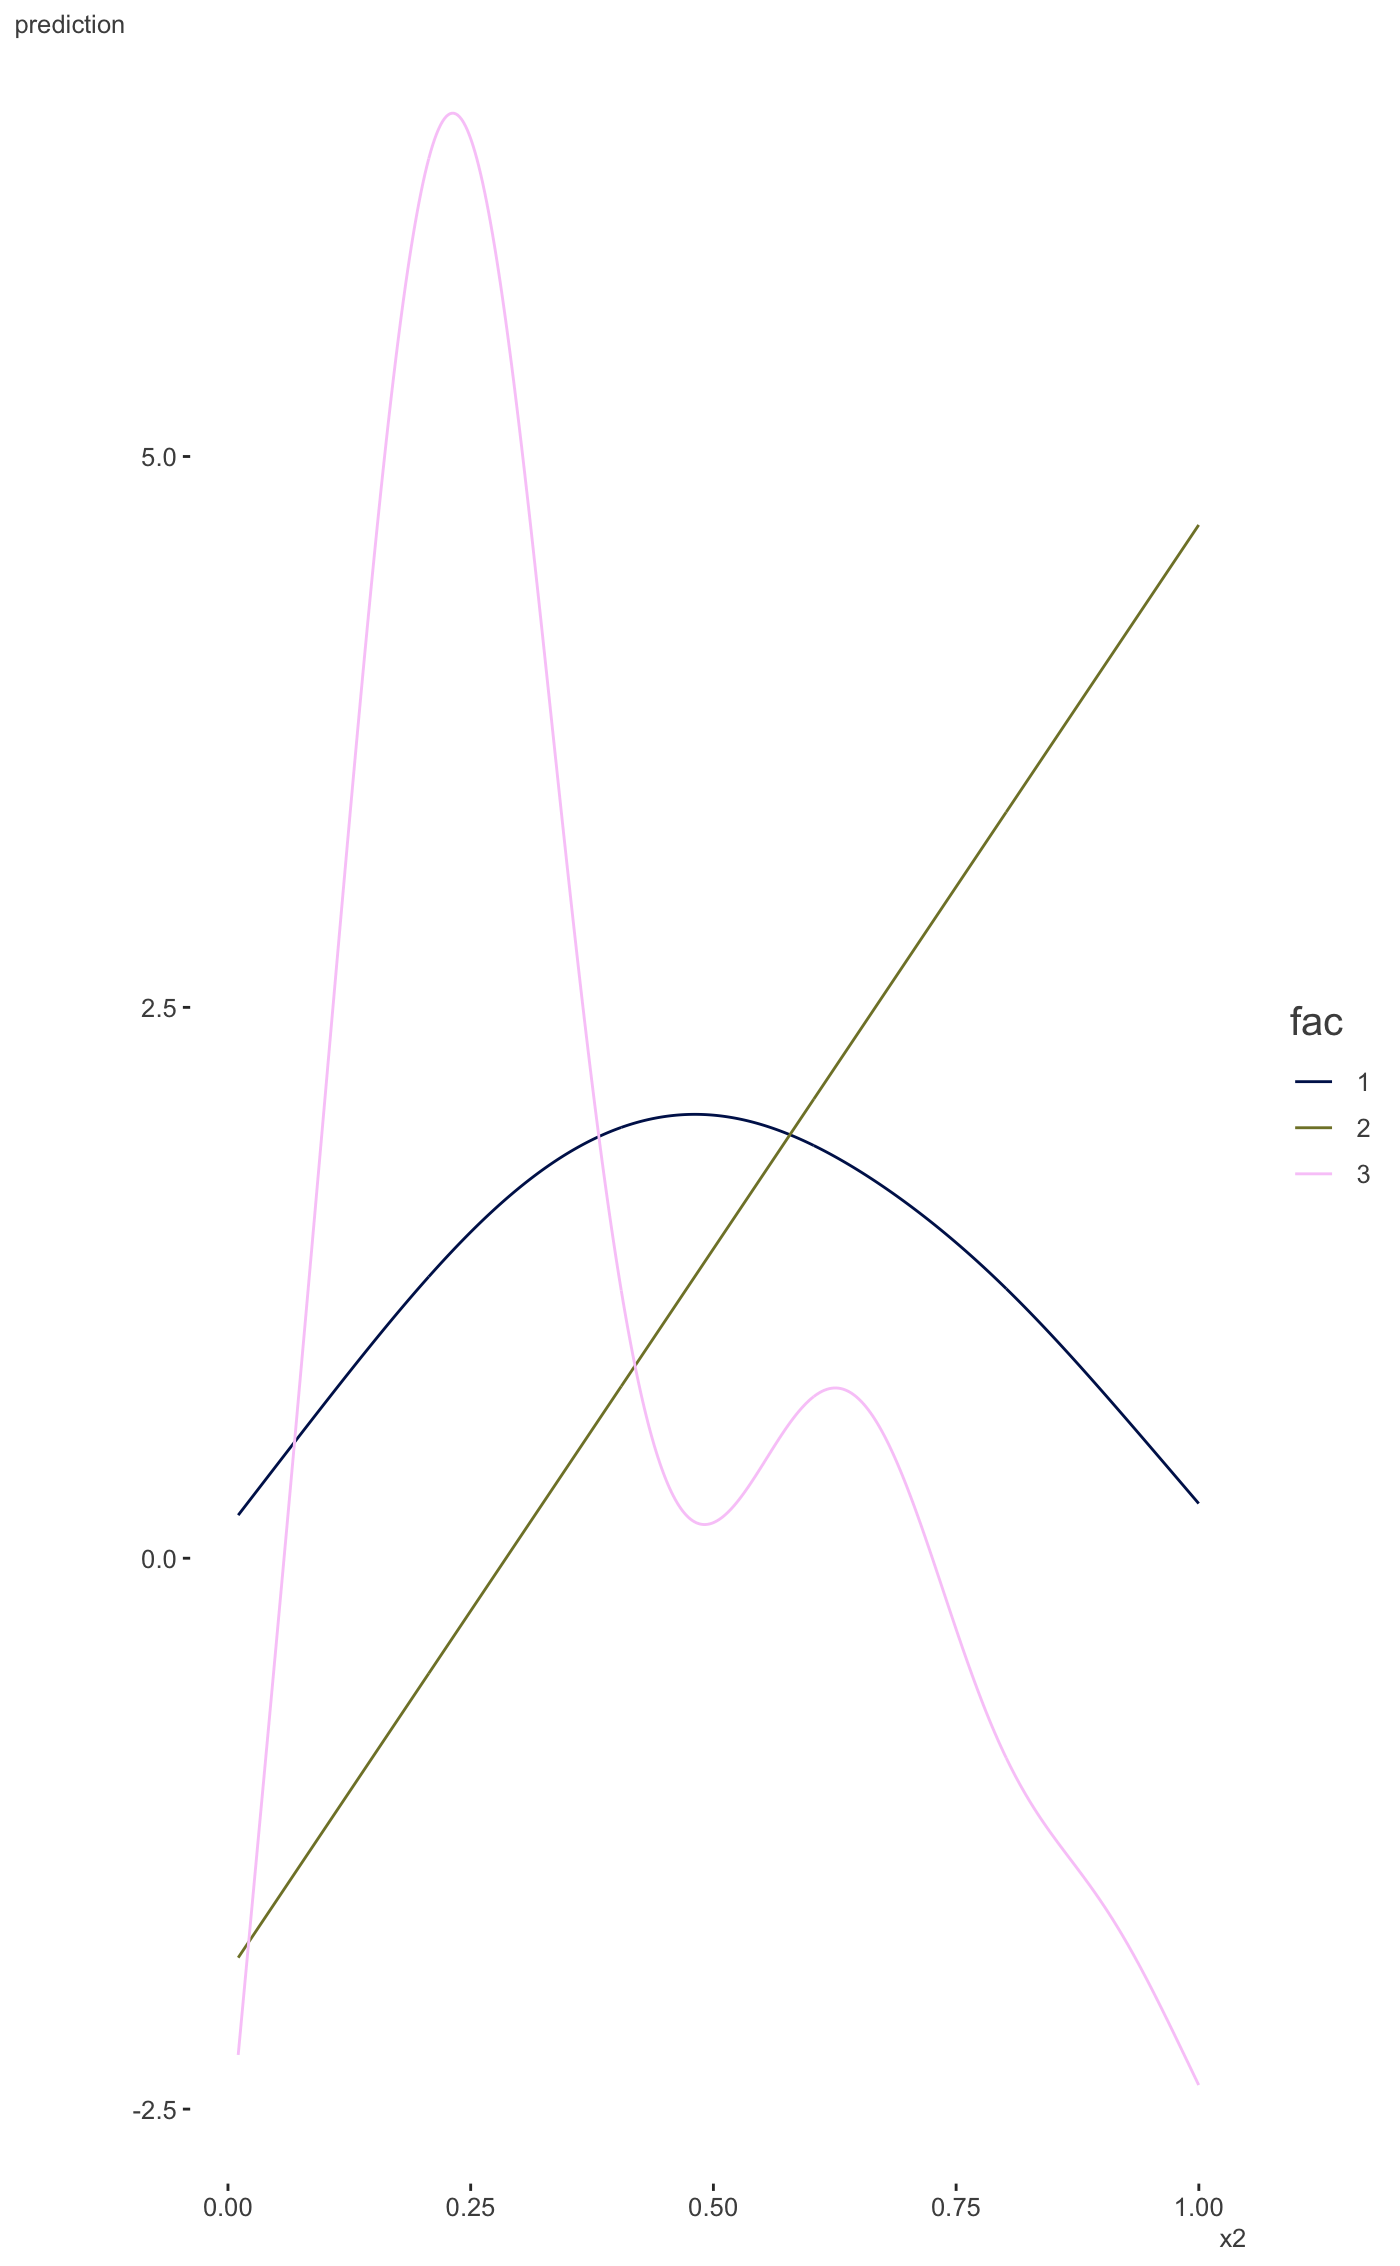
| by_var | Required for plot_gam_by. The categorical variable of interest. |
Value
A ggplot of the 2d effect.
Details
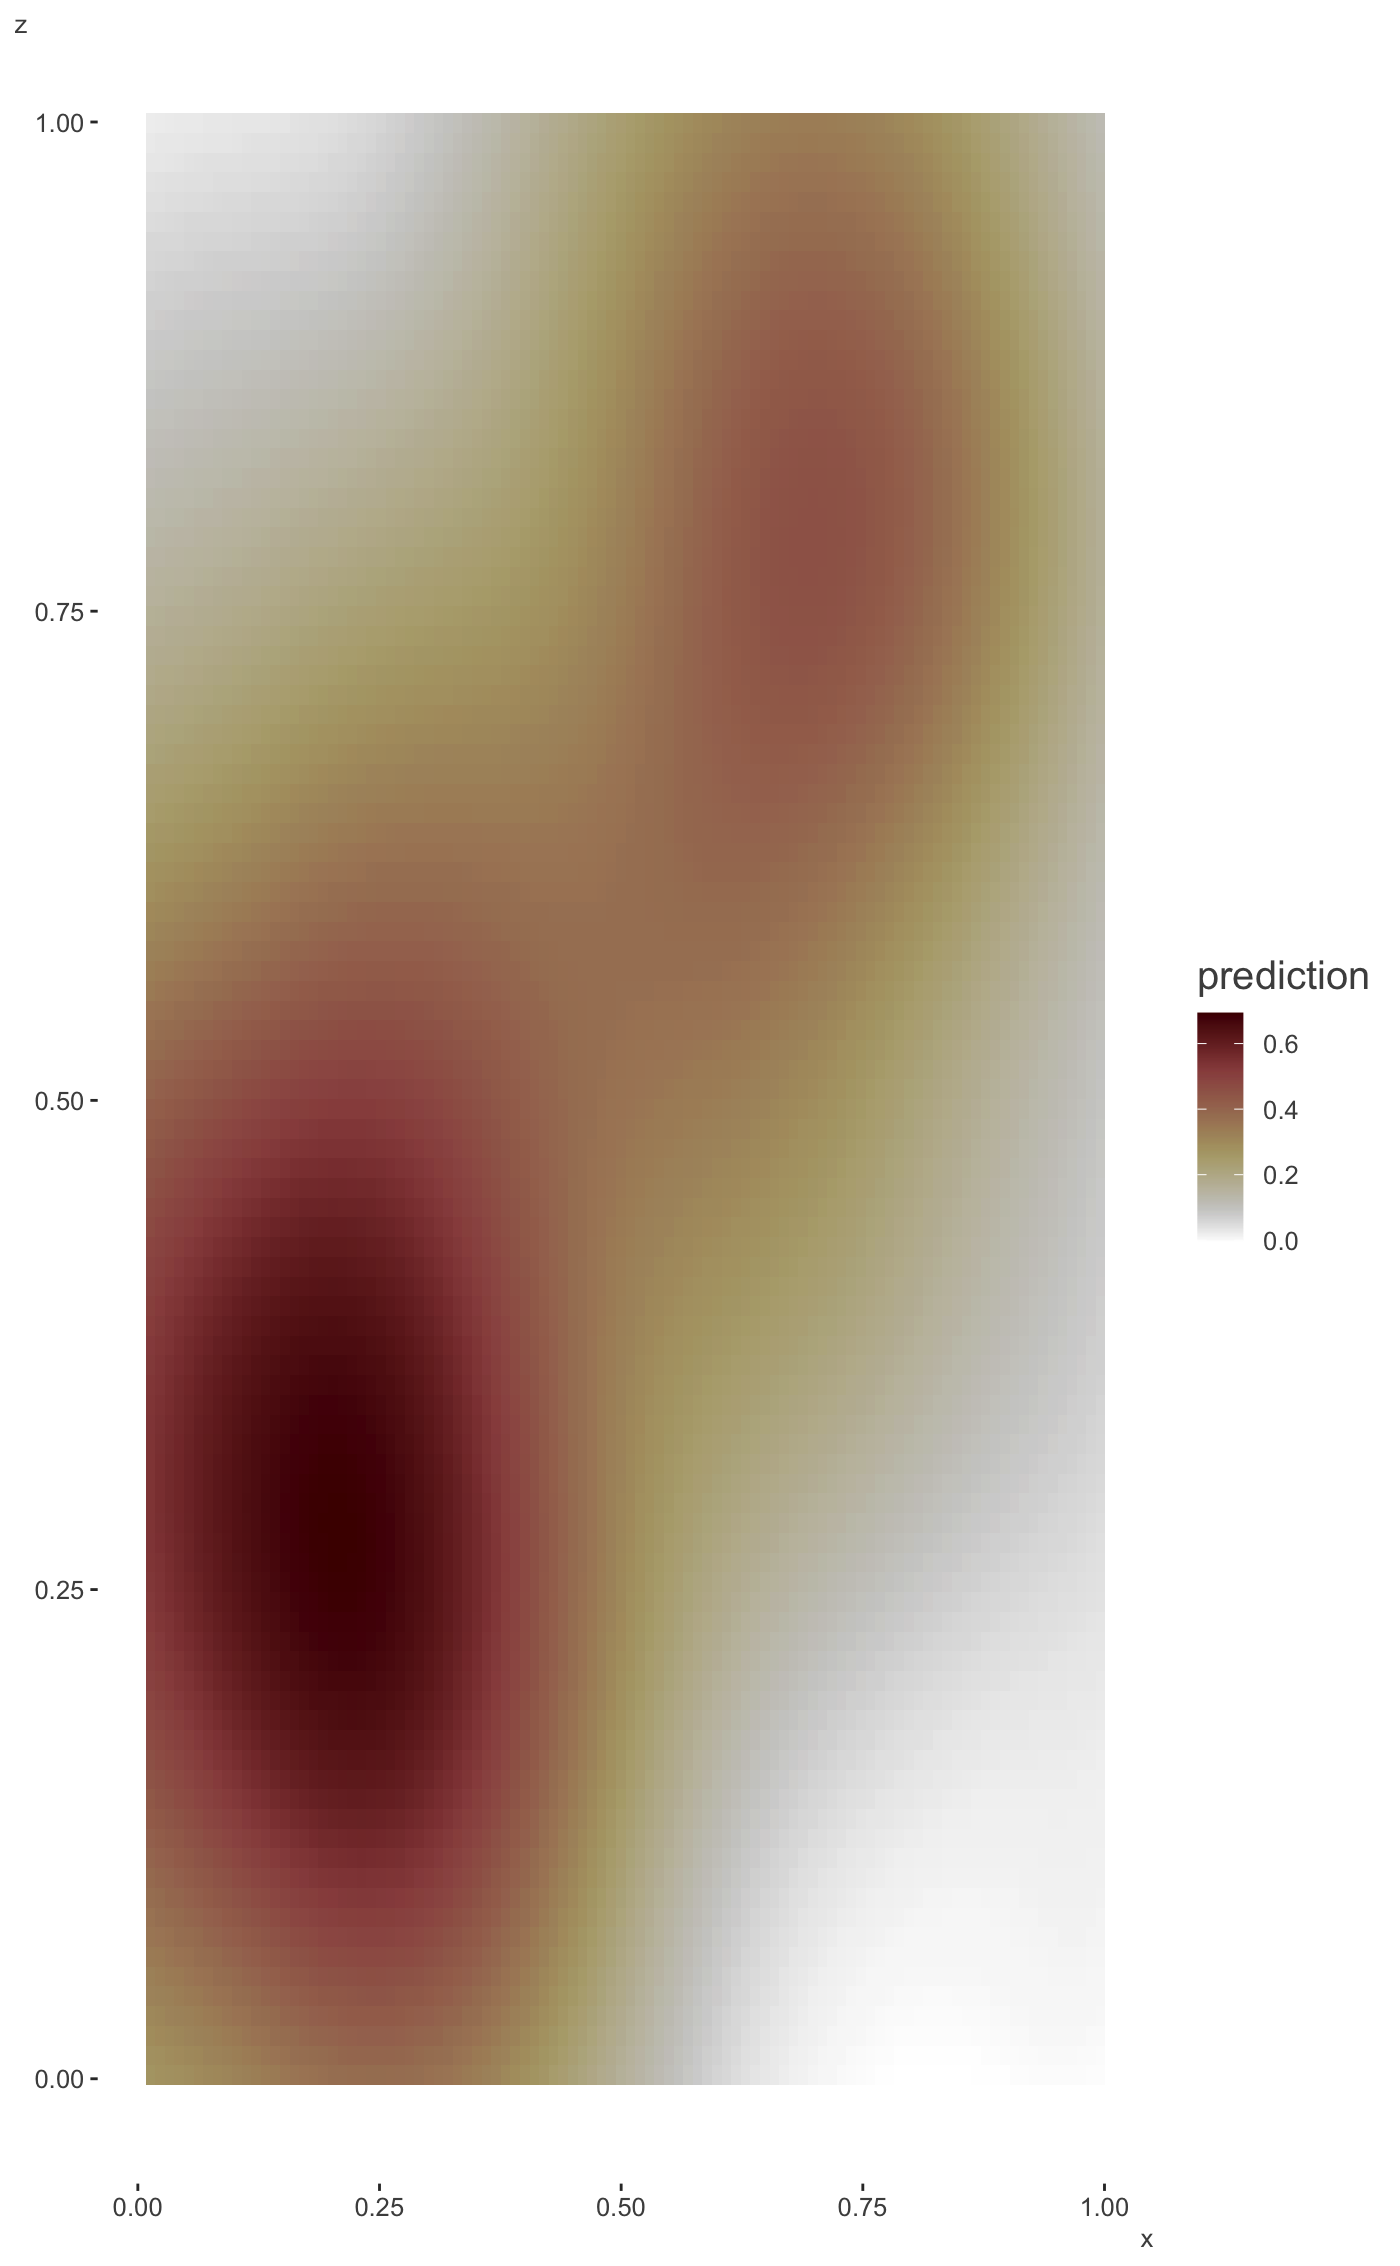
These functions plot the predictions for two covariates in a GAM
model produced by the mgcv package. The plot_gam_2d
function is used for plotting two continuous predictors, while
plot_gam_by is used in the case where one of the variables is
categorical. If plot_gam_2d is called with the second variable being
categorical or of very few distinct values, a message will follow along
with a switch to plot_gam_by. One can override this with the
force_2d argument.
Note
Any attempt to use a non-numeric variable for the main_var will result in failure.
If you are using gamm or gamm4 then you need to supply the mgcv model as the model object.
See also
scale_fill_scico scale_colour_viridis_d
Other model visualization:
plot_coefficients.brmsfit(),
plot_coefficients.lm(),
plot_coefficients.merMod(),
plot_coefficients(),
plot_gam_3d(),
plot_gam_check(),
plot_gam()
Examples
#> Bivariate smoothing exampleplot_gam_2d(mod, main_var = x, second_var = z, palette='oslo')#> Factor `by' variable example